
The prime objective of the Baseline Survey under NNP is to develop a “pool of information” to prepare “Detail Project Report (DPR)” for the respective Schemes. Baseline survey is done to get a detailed assessment of the project area with regards to population, socio economic status and water &sanitation facilities within the project area. More over the baseline survey of the household also works as the consumer data base for community contribution collection and providing water supply connection.
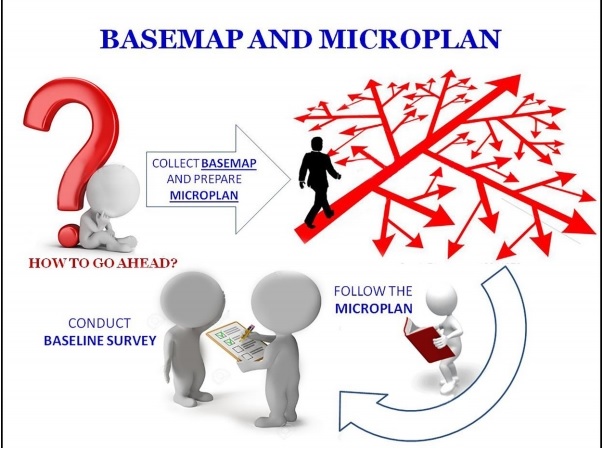
Assam has completed the baseline survey for batch-I & Batch-II. Batch-I recorded 11% households in addition to the DPR estimations, while Batch-II has estimated 117654 households. Thus 235918 households are geo- tagged and located on Google Map. Batch-II DPRs are based on the estimation of households and population from the baseline survey. The baseline survey was done on a Tablet device and the data resulting from the survey directly hosted to the website. Data from the baseline survey have been verified and accepted as accurate.
|
INDICATORS |
BATCH-I |
BATCH-II |
||||
|
KAMRUP (M) |
JORHAT |
HAILAKANDI |
BONGAIGAON |
SIVASAGAR |
MORIGAON |
|
|
No. of Households |
37,706 |
58,057 |
21,023 |
48,293 |
36,200 |
33,339 |
|
No. of Population |
1,87,185 |
2,58,496 |
1,08,754 |
2,27,225 |
1,66,967 |
1,60,052 |
|
Male |
93,908 |
1,29,687 |
55,894 |
1,15,514 |
84,271 |
80,862 |
|
Female |
93,277 |
1,28,809 |
52,860 |
1,11,711 |
82,696 |
79,190 |
|
Present - Source of Water |
||||||
|
Public Piped water Supply/ Stand Post |
6,945 |
19,697 |
1,396 |
415 |
7,127 |
2,214 |
|
Community Hand Pump/ Open Well |
3,344 |
2,236 |
607 |
2,354 |
1,390 |
3,352 |
|
Private Hand Pump/ Open Well |
18,255 |
12,319 |
1,109 |
40,096 |
14,031 |
24,162 |
|
Rain Water Harvesting |
15 |
175 |
88 |
10 |
10 |
7 |
|
Borewell well/Tube |
3,614 |
13,121 |
657 |
4,048 |
8,510 |
2,331 |
|
Pond & River |
2,278 |
9,690 |
16,532 |
949 |
4,776 |
687 |
|
Other Traditional Sources |
3,255 |
819 |
634 |
421 |
356 |
586 |
|
Physical Water Quality Problem |
||||||
|
YES |
16,754 |
37,504 |
18,900 |
22,029 |
26,366 |
22,191 |
|
NO |
20,952 |
20,553 |
2,123 |
26,264 |
9,834 |
11,148 |
|
Availability of Toilet |
||||||
|
YES (Functional) |
20,216 |
31,240 |
6,805 |
27,086 |
19,750 |
9,971 |
|
YES (Dysfunctional) |
3,048 |
7,182 |
2,507 |
3,557 |
5,757 |
2,455 |
|
NO |
14,442 |
19,635 |
11,711 |
17,650 |
10,693 |
20,913 |
|
Method used for disposal of Solid Waste |
||||||
|
Burning |
22,044 |
22,257 |
1,757 |
15,193 |
10,422 |
8,641 |
|
Composting |
580 |
1,767 |
2,946 |
3,568 |
3,053 |
3,601 |
|
Segregation and Safe Disposal |
955 |
3,678 |
563 |
3,017 |
5,216 |
376 |
|
Thrown Out |
9,977 |
27,730 |
14,522 |
24,672 |
12,043 |
15,967 |
|
Other |
4,150 |
2,625 |
1,235 |
1,843 |
5,466 |
4,754 |
| Title | Size | Detail |
|---|---|---|
| Jorhat | 2.26 MB | |
| Hailakandi | 858.07 KB | |
| Kamrup | 1.6 MB | |
| Morigaon | 2.19 MB | |
| Sivasagar | 942.41 KB | |
| Bongaigaon | 1.11 MB |